Fleet statistics
The Statistiche (statistics) page analyses the use of the fleet over a period. Open it with the Statistiche button on the fleet home.
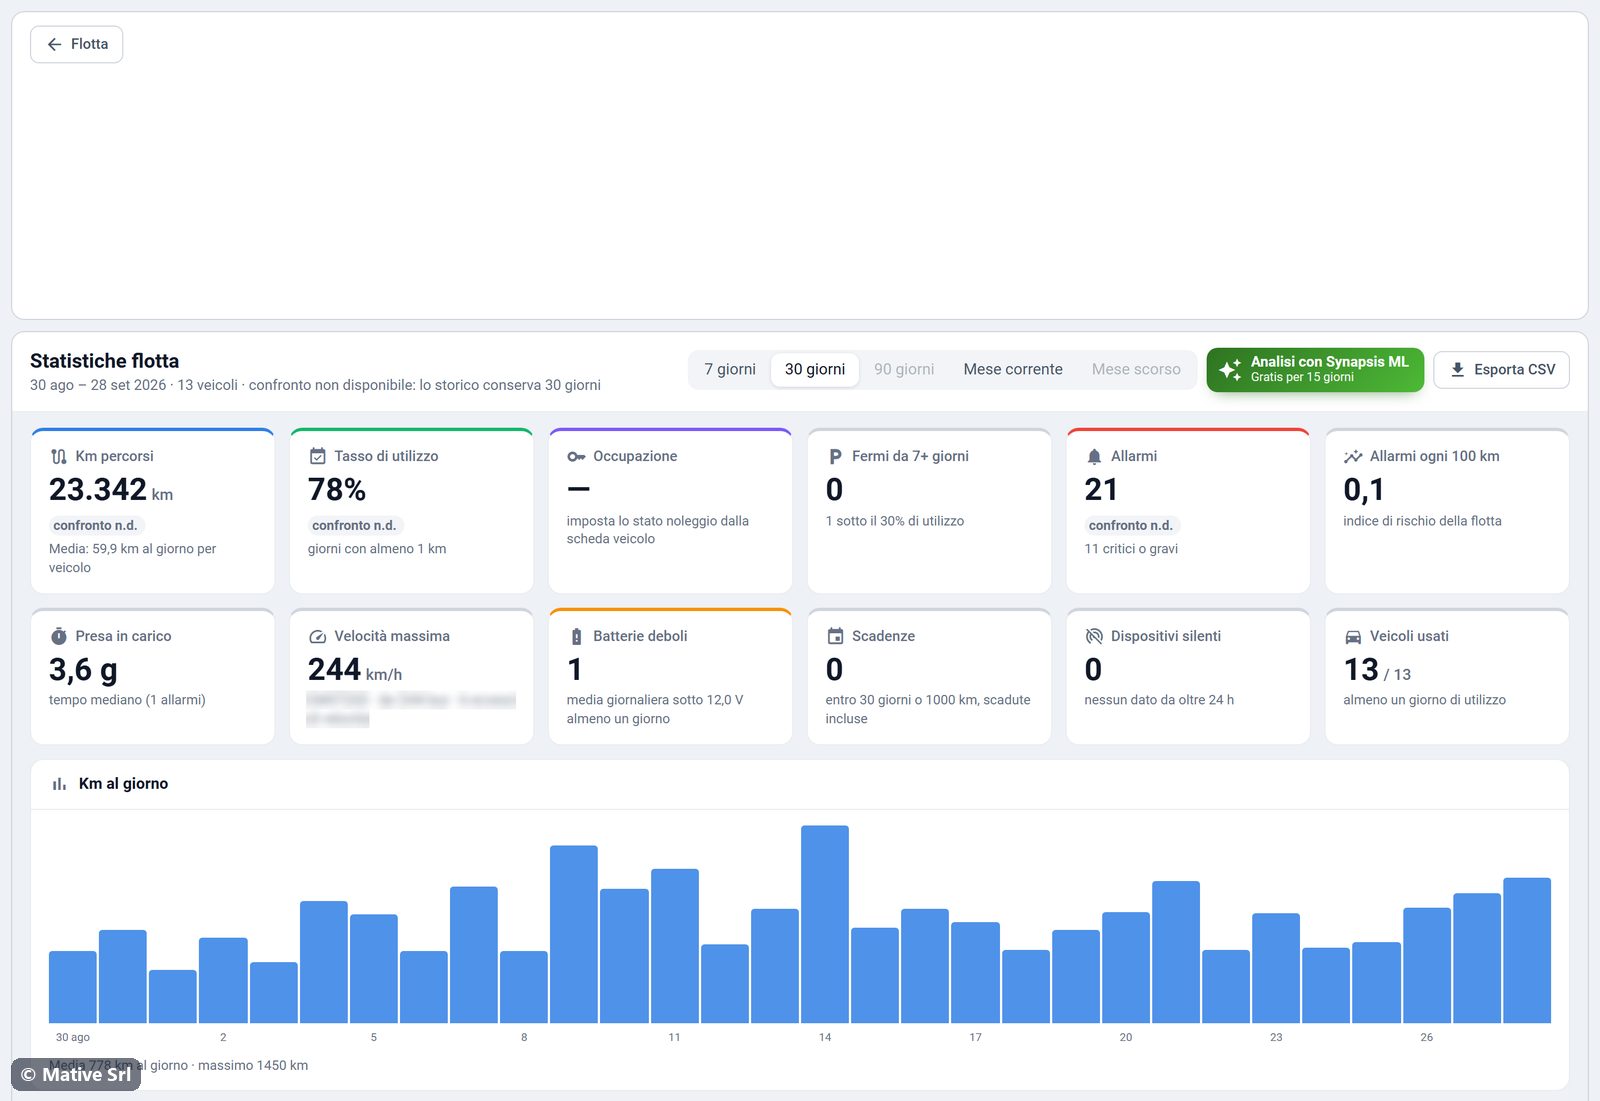
Period and export
- 7 giorni, 30 giorni, 90 giorni, Mese corrente, Mese scorso: the period to analyse. Periods longer than the history kept by the platform are disabled. The line under the title shows the dates, the number of vehicles and whether the comparison with the previous period is available.
- Esporta CSV exports the statistics.
- Analisi con Synapsis ML opens the Synapsis ML analysis of the fleet (free for 15 days).
KPIs
| KPI | Meaning |
|---|---|
| Km percorsi | Km driven by the fleet, with the average per vehicle per day |
| Tasso di utilizzo | Share of days in which vehicles drove at least 1 km |
| Occupazione | Share of time vehicles were rented, from the rental status history |
| Fermi da 7+ giorni | Vehicles not used for 7 days or more, and vehicles used less than 30% of the days |
| Allarmi | Alarms in the period, with how many were critical or major |
| Allarmi ogni 100 km | Alarms per 100 km driven: a risk index of the fleet |
| Presa in carico | Median time between an alarm and its take charge |
| Velocità massima | Highest speed in the period, with the vehicle and the source (GPS or CAN) |
| Batterie deboli | Vehicles with a daily average battery voltage under 12.0 V on at least one day |
| Scadenze | Vehicles with deadlines within 30 days or 1,000 km, expired ones included |
| Dispositivi silenti | Trackers with no data for more than 24 hours |
| Veicoli usati | Vehicles used on at least one day, out of the total |
When the previous period is available, the KPIs also show the change against it.
Charts
Km al giorno (km per day) shows the km driven by the fleet every day, with the daily average and the maximum.
Utilizzo per veicolo e giorno (usage per vehicle and day) is a heatmap: one row per vehicle, one column per day. The darker the square, the more km that day (0, under 20, under 60, under 150, 150 km and more). The km of the period are on the right.
Classifica veicoli (vehicle ranking) orders the vehicles by km, with the usage rate. Switch between Più usati (most used) and Meno usati (least used).
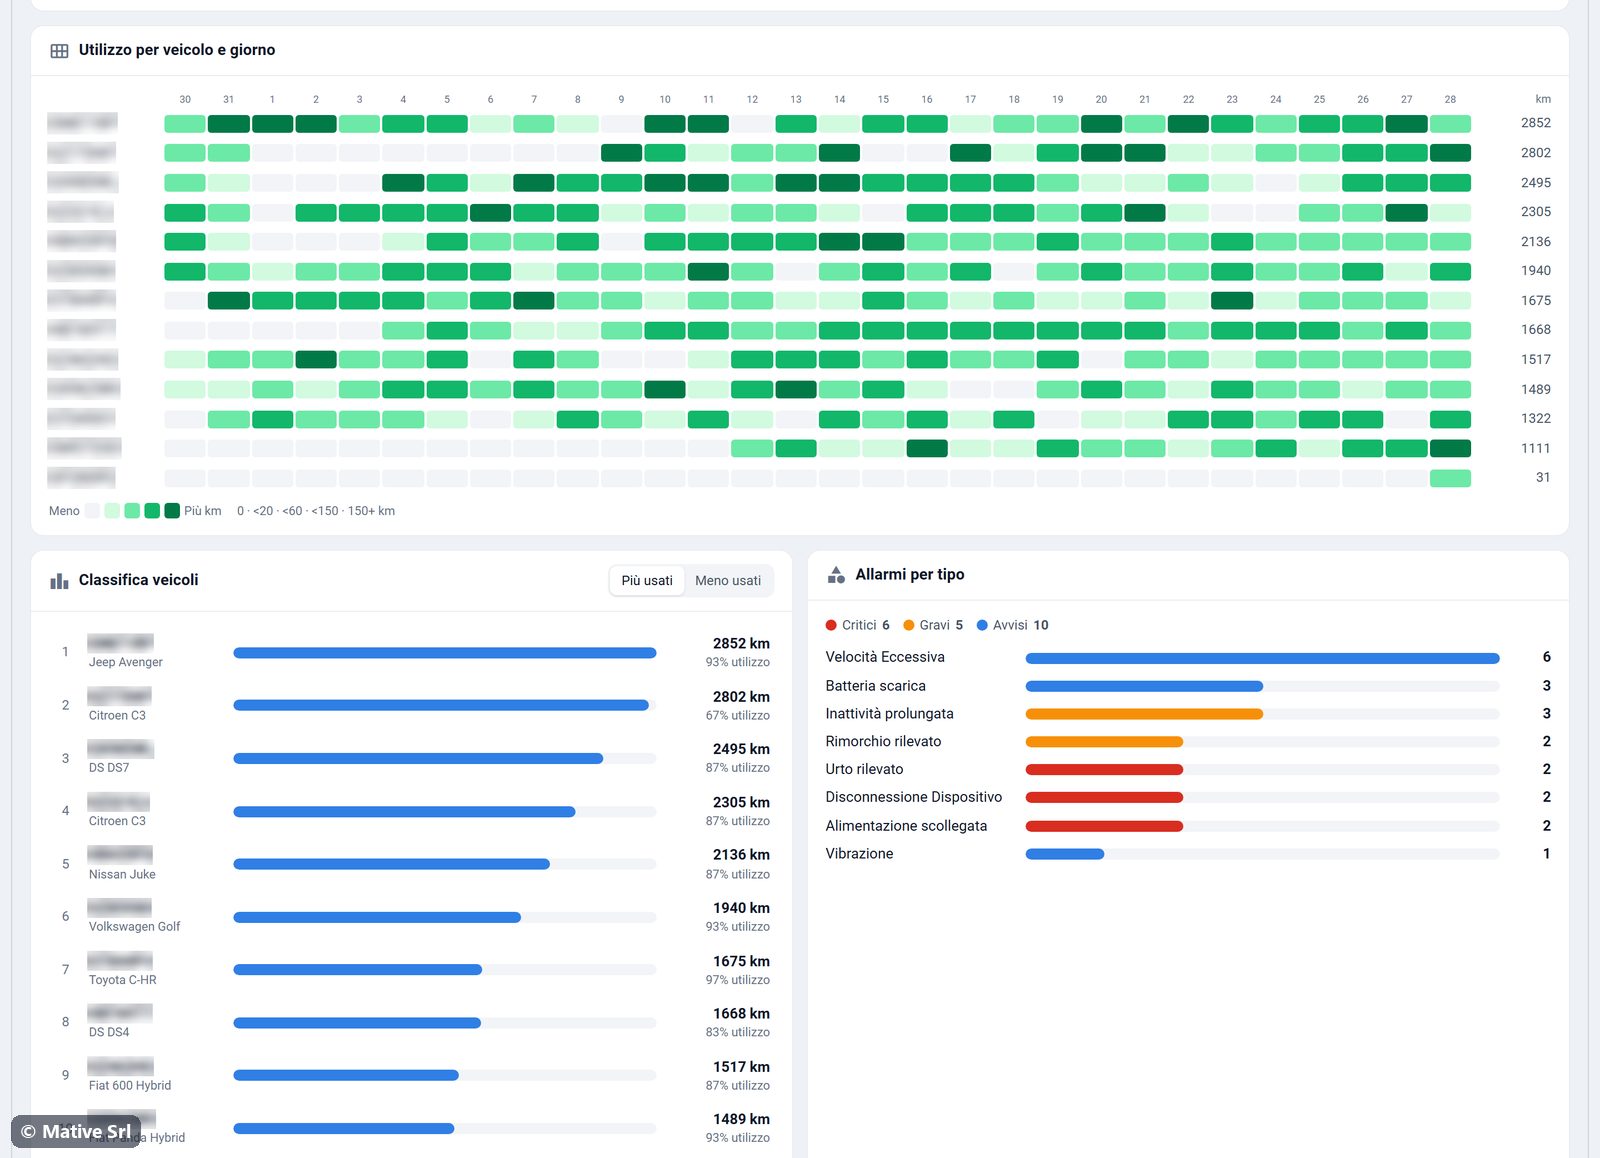
- Allarmi per tipo (alarms by type): alarms of the period by type and severity.
- Stato del parco (oggi) (fleet status today): vehicles by rental status, vehicles used in the period and trackers silent for more than 24 hours.
- Scadenze in arrivo (upcoming deadlines): deadlines in the next 60 days.
- Salute batterie (battery health): the lowest daily average voltage of each vehicle. A battery is healthy from 12.4 V, and should be checked below 12.0 V.
- Allarmi al giorno (alarms per day): alarms of the fleet day by day.
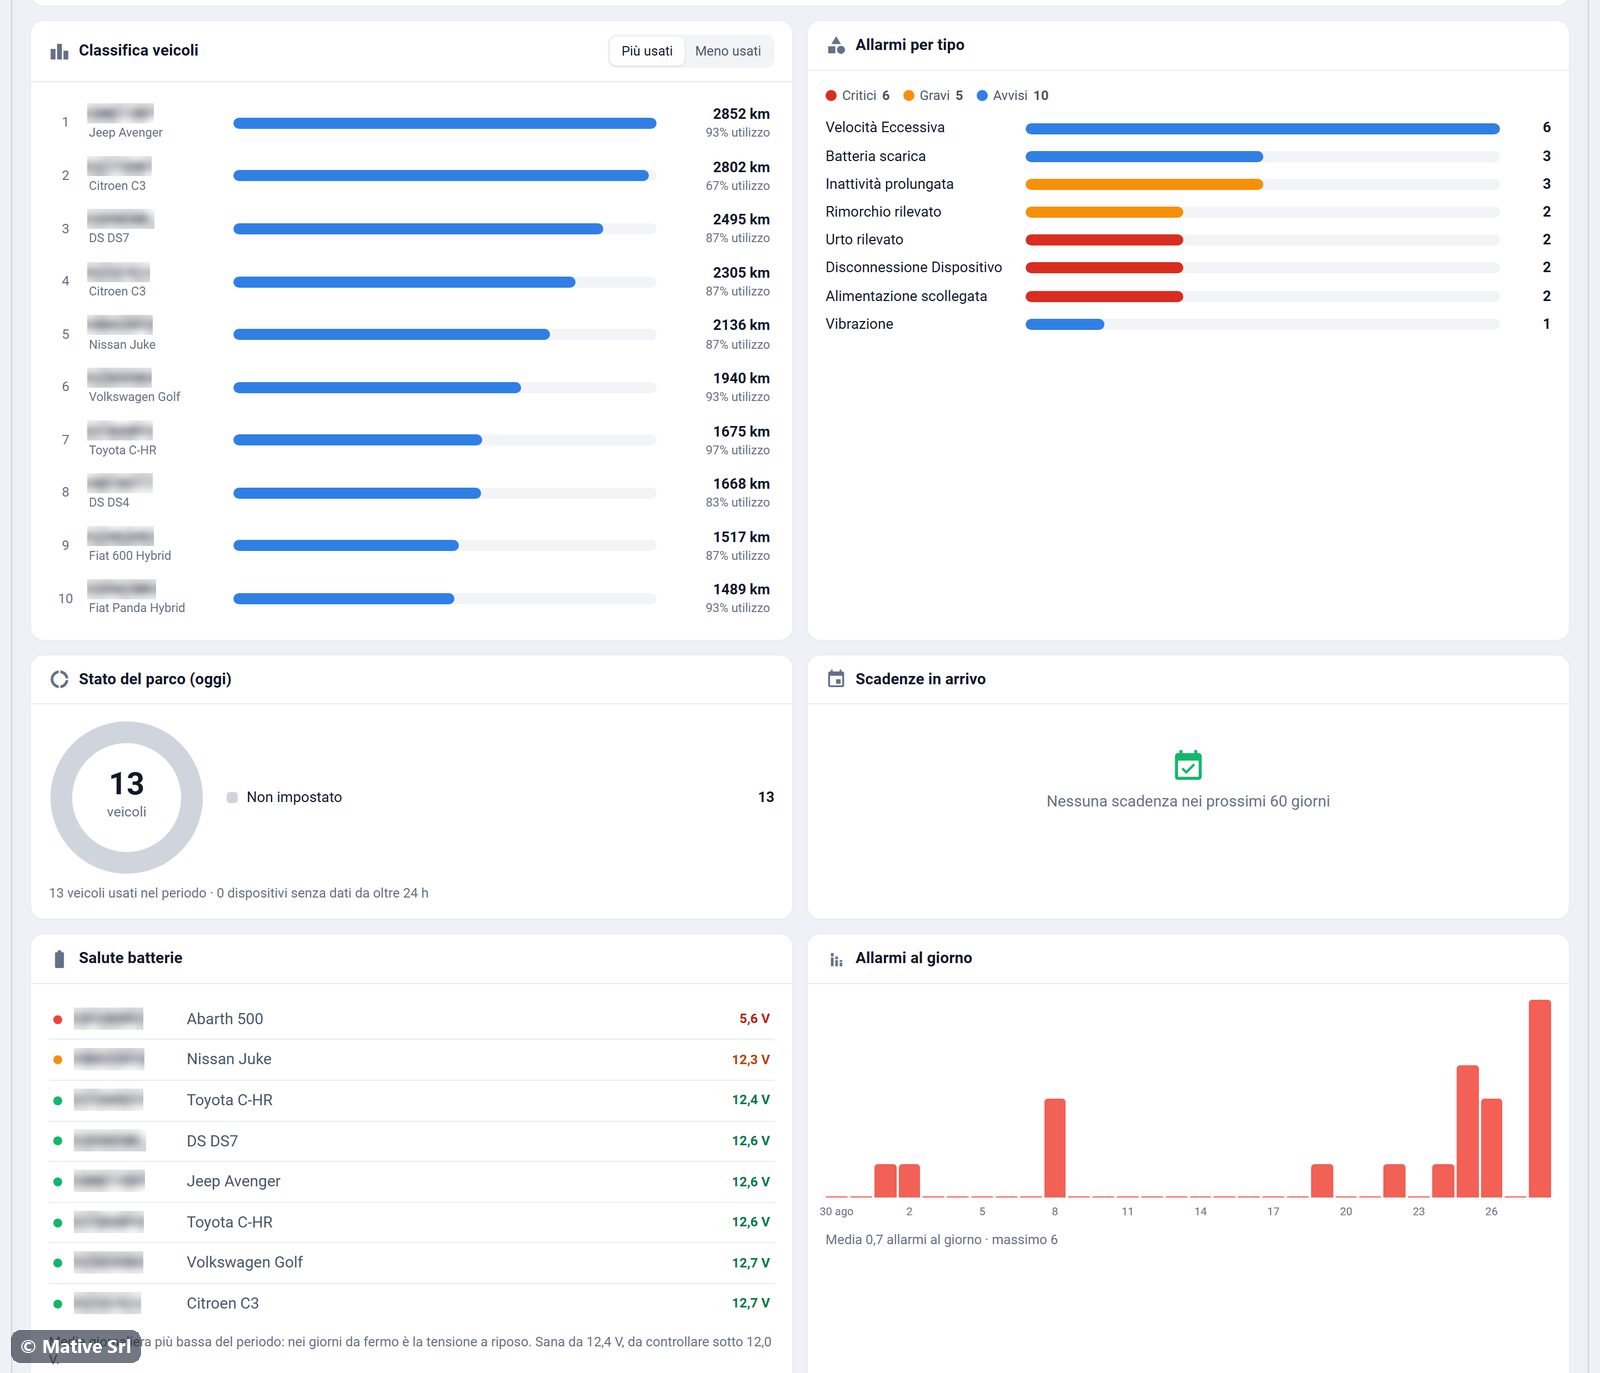
Table per vehicle
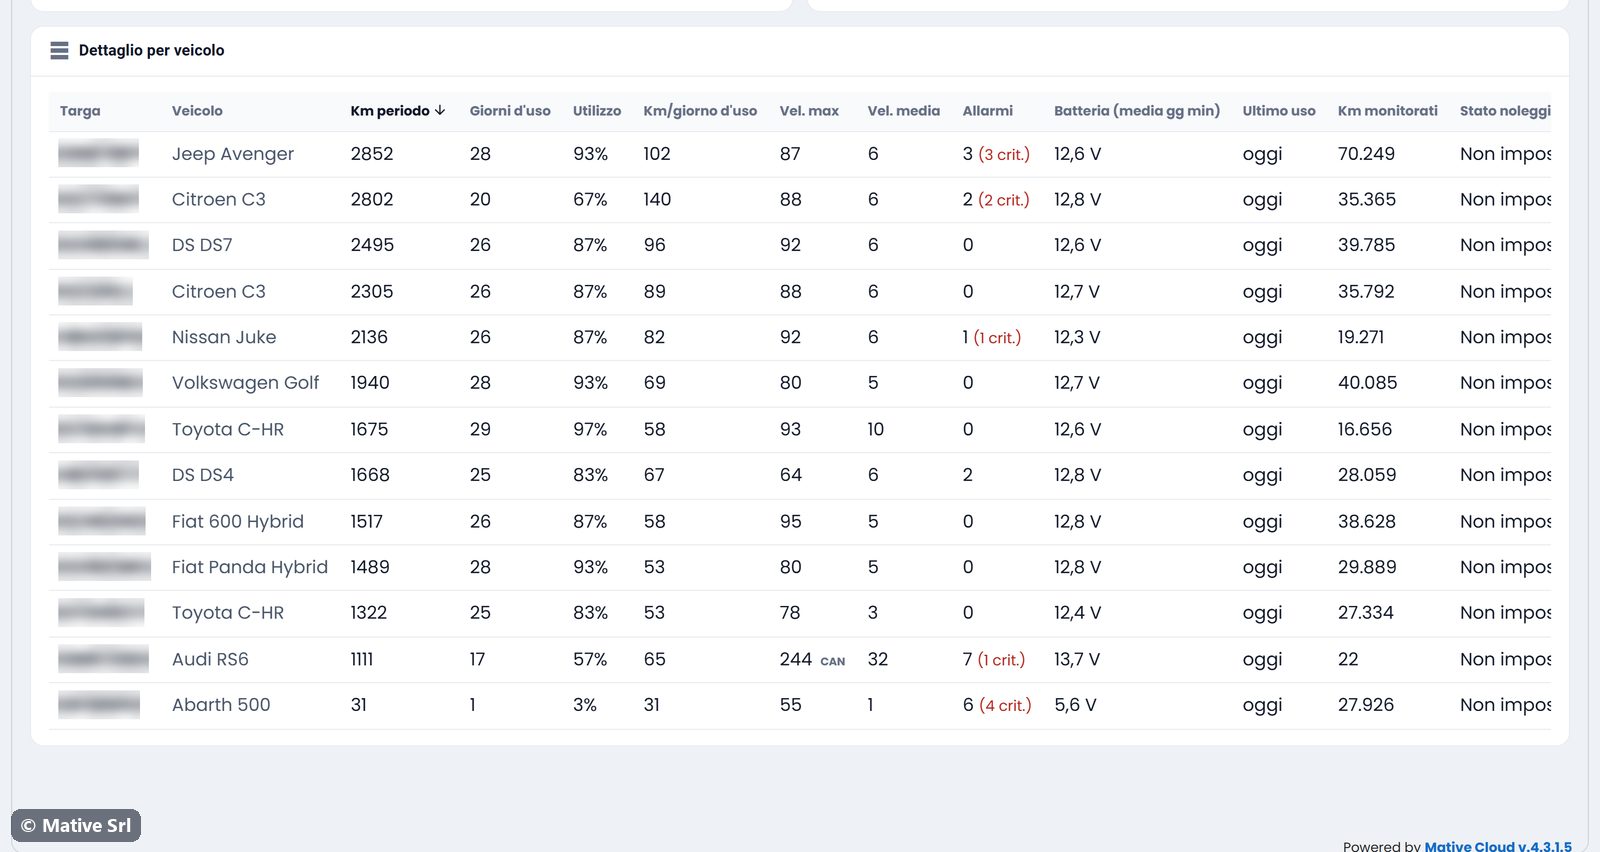
Dettaglio per veicolo (detail per vehicle) has one row per vehicle: plate, vehicle, km in the period, days of use, usage, km per day of use, maximum and average speed, alarms (critical ones in red), battery (lowest daily average), last use, monitored km and rental status. Click a column header to sort the table, and click again to reverse the order.
How the data is calculated
- Km per day come from the difference in the odometer reading.
- A day counts as a day of use when the vehicle drives at least 1 km.
- Occupancy is calculated from the history of the rental status you set in the vehicle header.
- Thresholds such as 7 days, 30%, 12.0 V and 24 hours are default values that your administrator can change.